

Boards and regulators stopped asking whether your AI is risky. They ask how much, in dollars. A color-coded grid can't answer that, and AI risk is the kind of risk that breaks the grid.
The 60-second version
Two things are arriving at the same time. Regulators now expect a real AI risk-assessment process: ISO/IEC 42001 makes it a clause-level requirement (6.1.2), and the NIST AI Risk Management Framework builds an entire function, MEASURE, around assessing AI risk in both quantitative and qualitative terms. At the same time the losses are getting specific. IBM's 2025 Cost of a Data Breach report put the global average at $4.44M, and breaches where attackers reached data through “shadow AI” cost about $670K more than the rest. Engineering firm Arup lost $25M to one deepfake video call.
So the board's question has changed. It is no longer “is this red or amber.” It is “how much annual loss are we carrying from AI, and what does the guardrail buy back.” A 5×5 heat map answers neither. It has no dollars in it, and it cannot add two AI risks together.
The heat map was built for a world with history.
A 5×5 grid asks you to place each risk by likelihood and impact, and each axis is a subjective bucket: low, medium, high. That works when you have years of incidents behind you, enough to calibrate what “likely” and “severe” really mean for your environment. Fire, fraud, and outages have that history. Insurers price them for a living.
AI risk does not have that history yet. The scenarios are new (prompt-injection through an agent, a data-exfiltration path that did not exist last quarter, a model swap that changes behavior overnight), and they move faster than any incident log can keep up with. So the assessment stalls in one of two ways. The team freezes because no one can defend a number, or it hand-waves a “high” that means nothing the board can act on. The grid gives false confidence either way: a color that looks like an answer and carries no information a CFO can use.
Two properties of AI risk make the grid worse, not just unhelpful. It flattens severity that should be miles apart: an agent with a remote-code-execution path and a chatbot that occasionally writes a wrong date can both land in the same amber square, reading as equal when in loss terms they differ by orders of magnitude. And it hides correlation: one model or one over-permissioned agent is a shared dependency behind many features, and when it fails it does not fail in one square, it fails across every product that calls it.
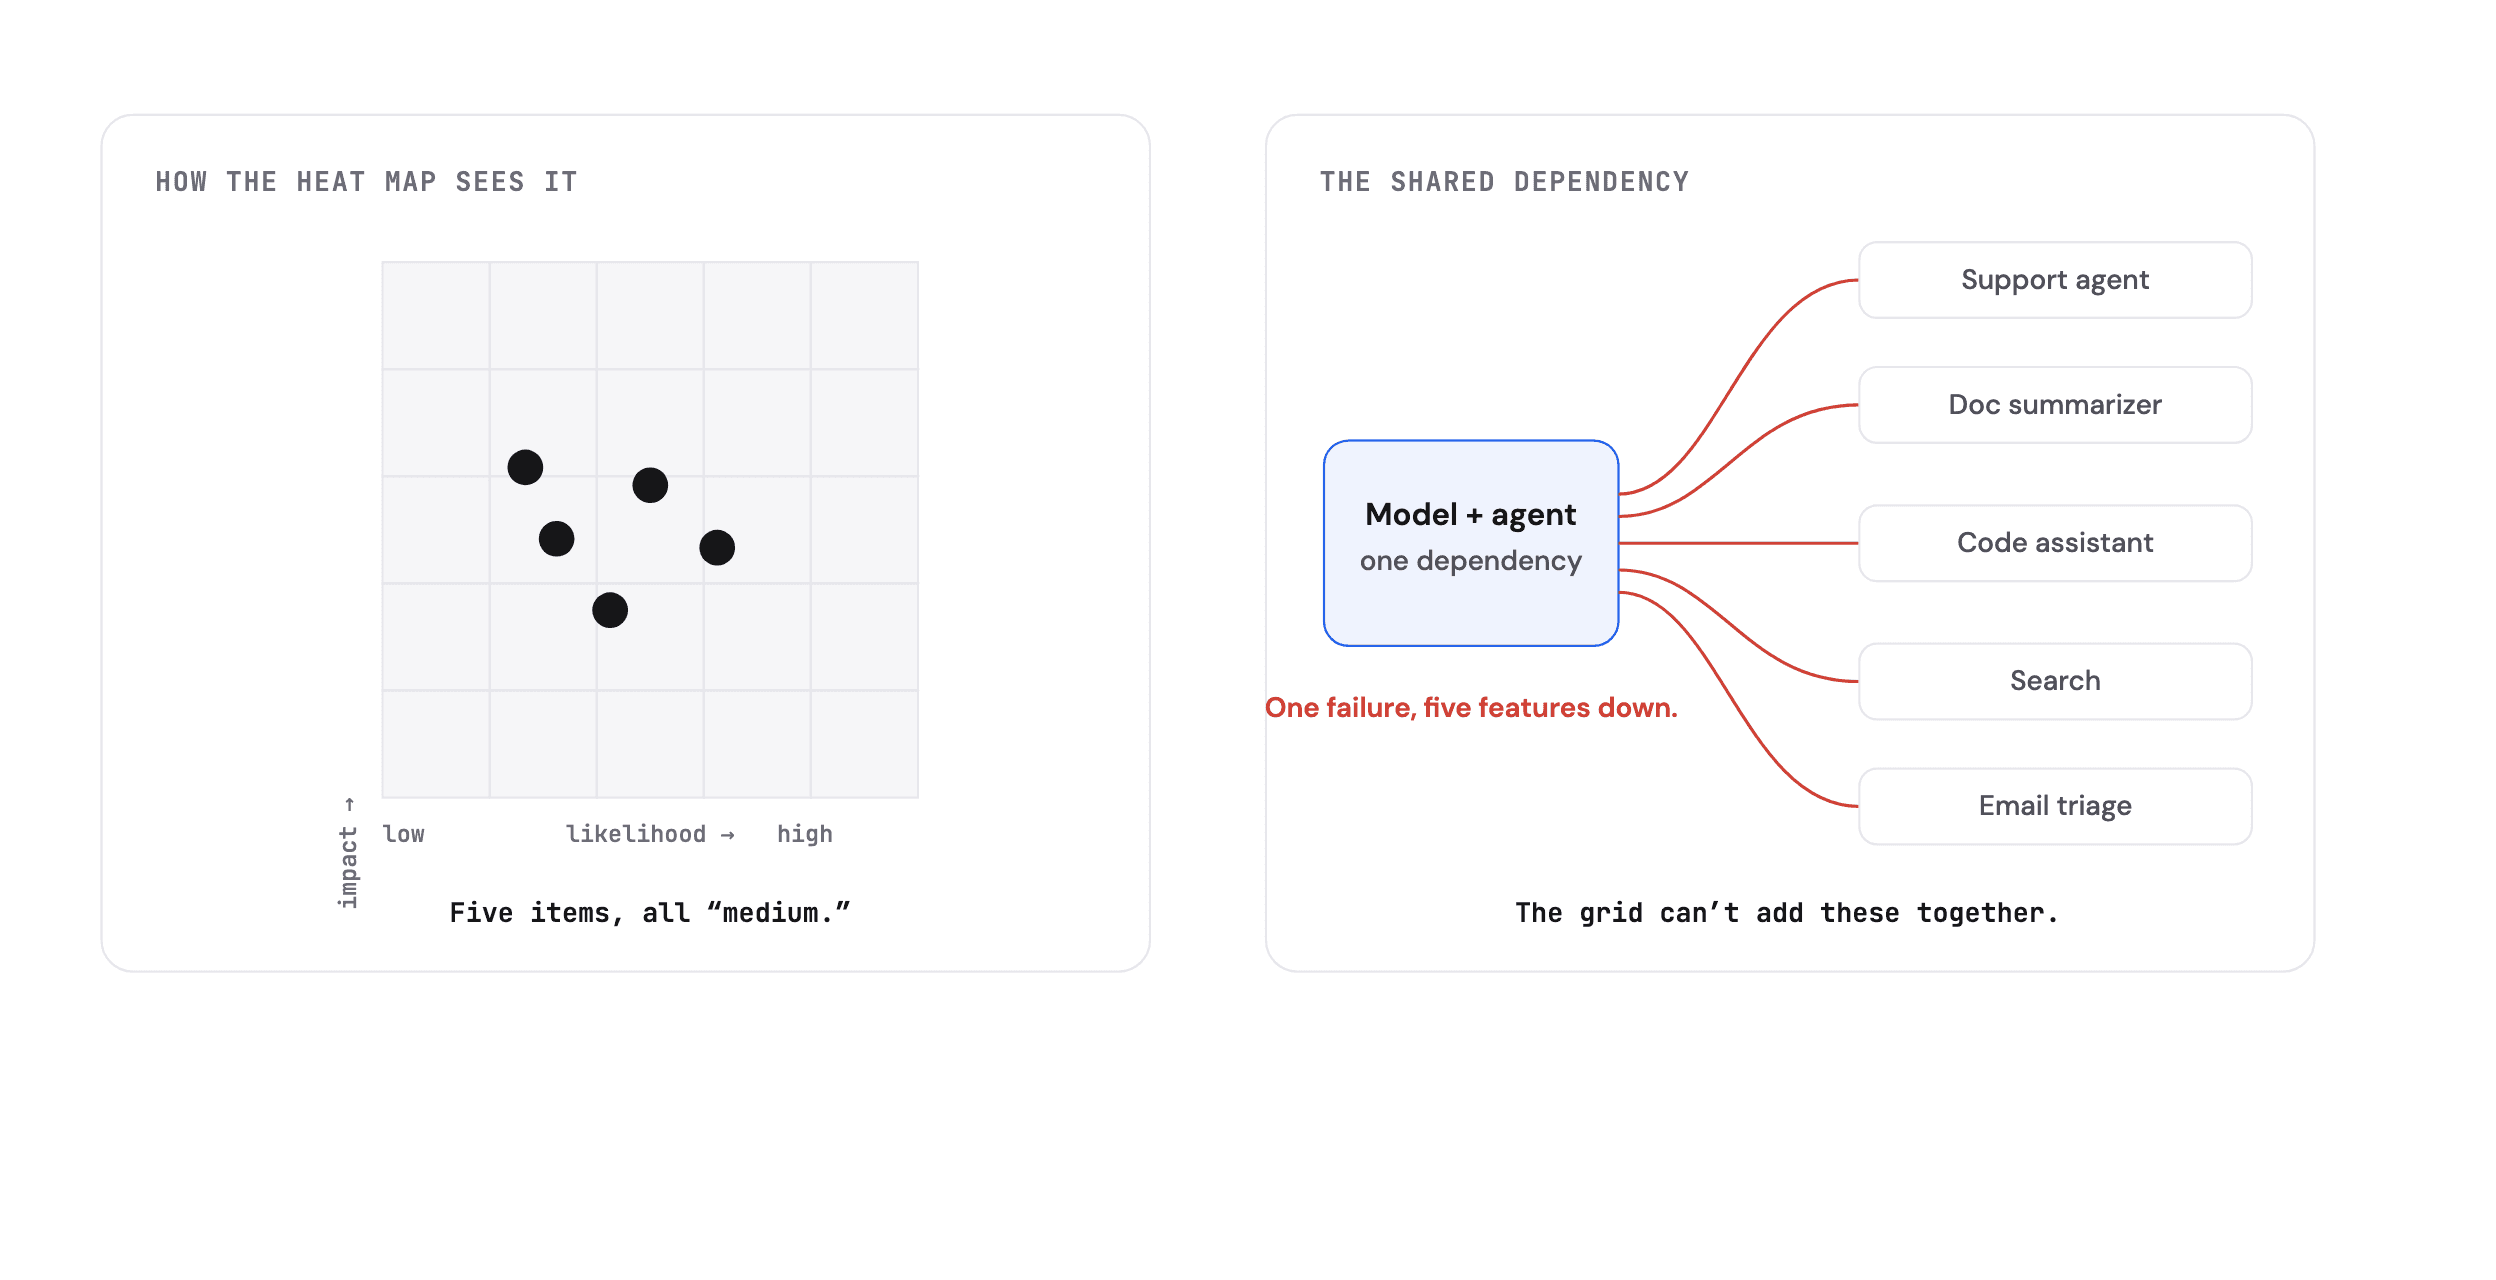
One model dependency sits behind many features. A heat map scores each square on its own, so a single correlated failure reads as several unrelated mediums.
A new, correlated, expensive risk, scored with a tool built for familiar ones.
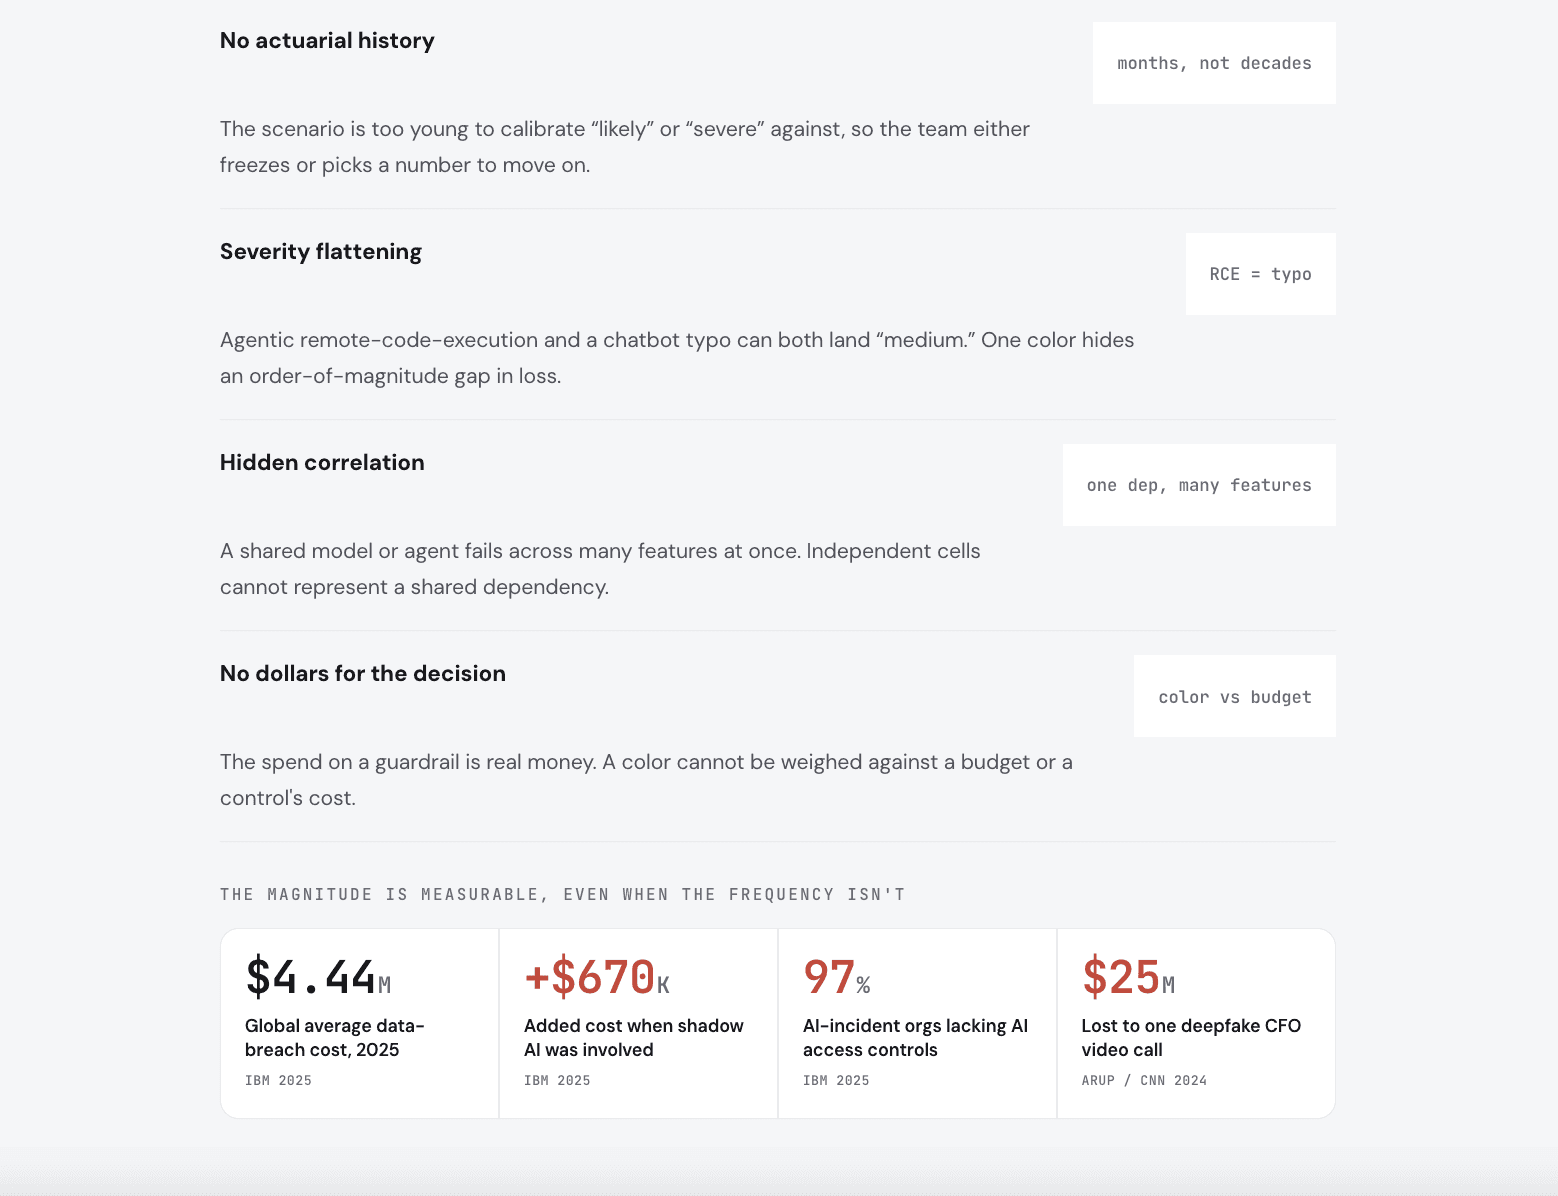
Give the risk a distribution, not a color.
The reframe is to stop scoring AI risk and start estimating it. The recognized way to do that is FAIR (Factor Analysis of Information Risk), an open standard held by The Open Group with a practitioner community at the FAIR Institute. FAIR does one useful thing: it breaks a risk into parts you can estimate, instead of asking you to intuit a single square.
Risk, in FAIR, is Loss Event Frequency × Loss Magnitude. Loss Event Frequency splits again into how often the scenario is attempted (Threat Event Frequency) and the chance your controls fail when it is (Vulnerability). Loss Magnitude splits into the primary loss (incident response, downtime) and the secondary loss (fines, legal, customer churn, reputation). You estimate each part as a range, a minimum, a most-likely, and a maximum, not a single guess. Then a Monte Carlo simulation samples those ranges thousands of times and produces a distribution of annualized loss exposure in dollars, with percentiles you can read off directly.
Take a real AI scenario: prompt-injection data exfiltration through an over-permissioned agent, the failure mode the earlier posts in this series walked through. You do not need to know exactly how often it will happen. You estimate a range for how often it is attempted, a range for the chance your guardrails fail, and a range for what a successful exfiltration costs. The simulation turns those into a loss curve. The point is not false precision. It is that the uncertainty becomes visible and bounded, a range on a chart, instead of hidden inside the word “high.”
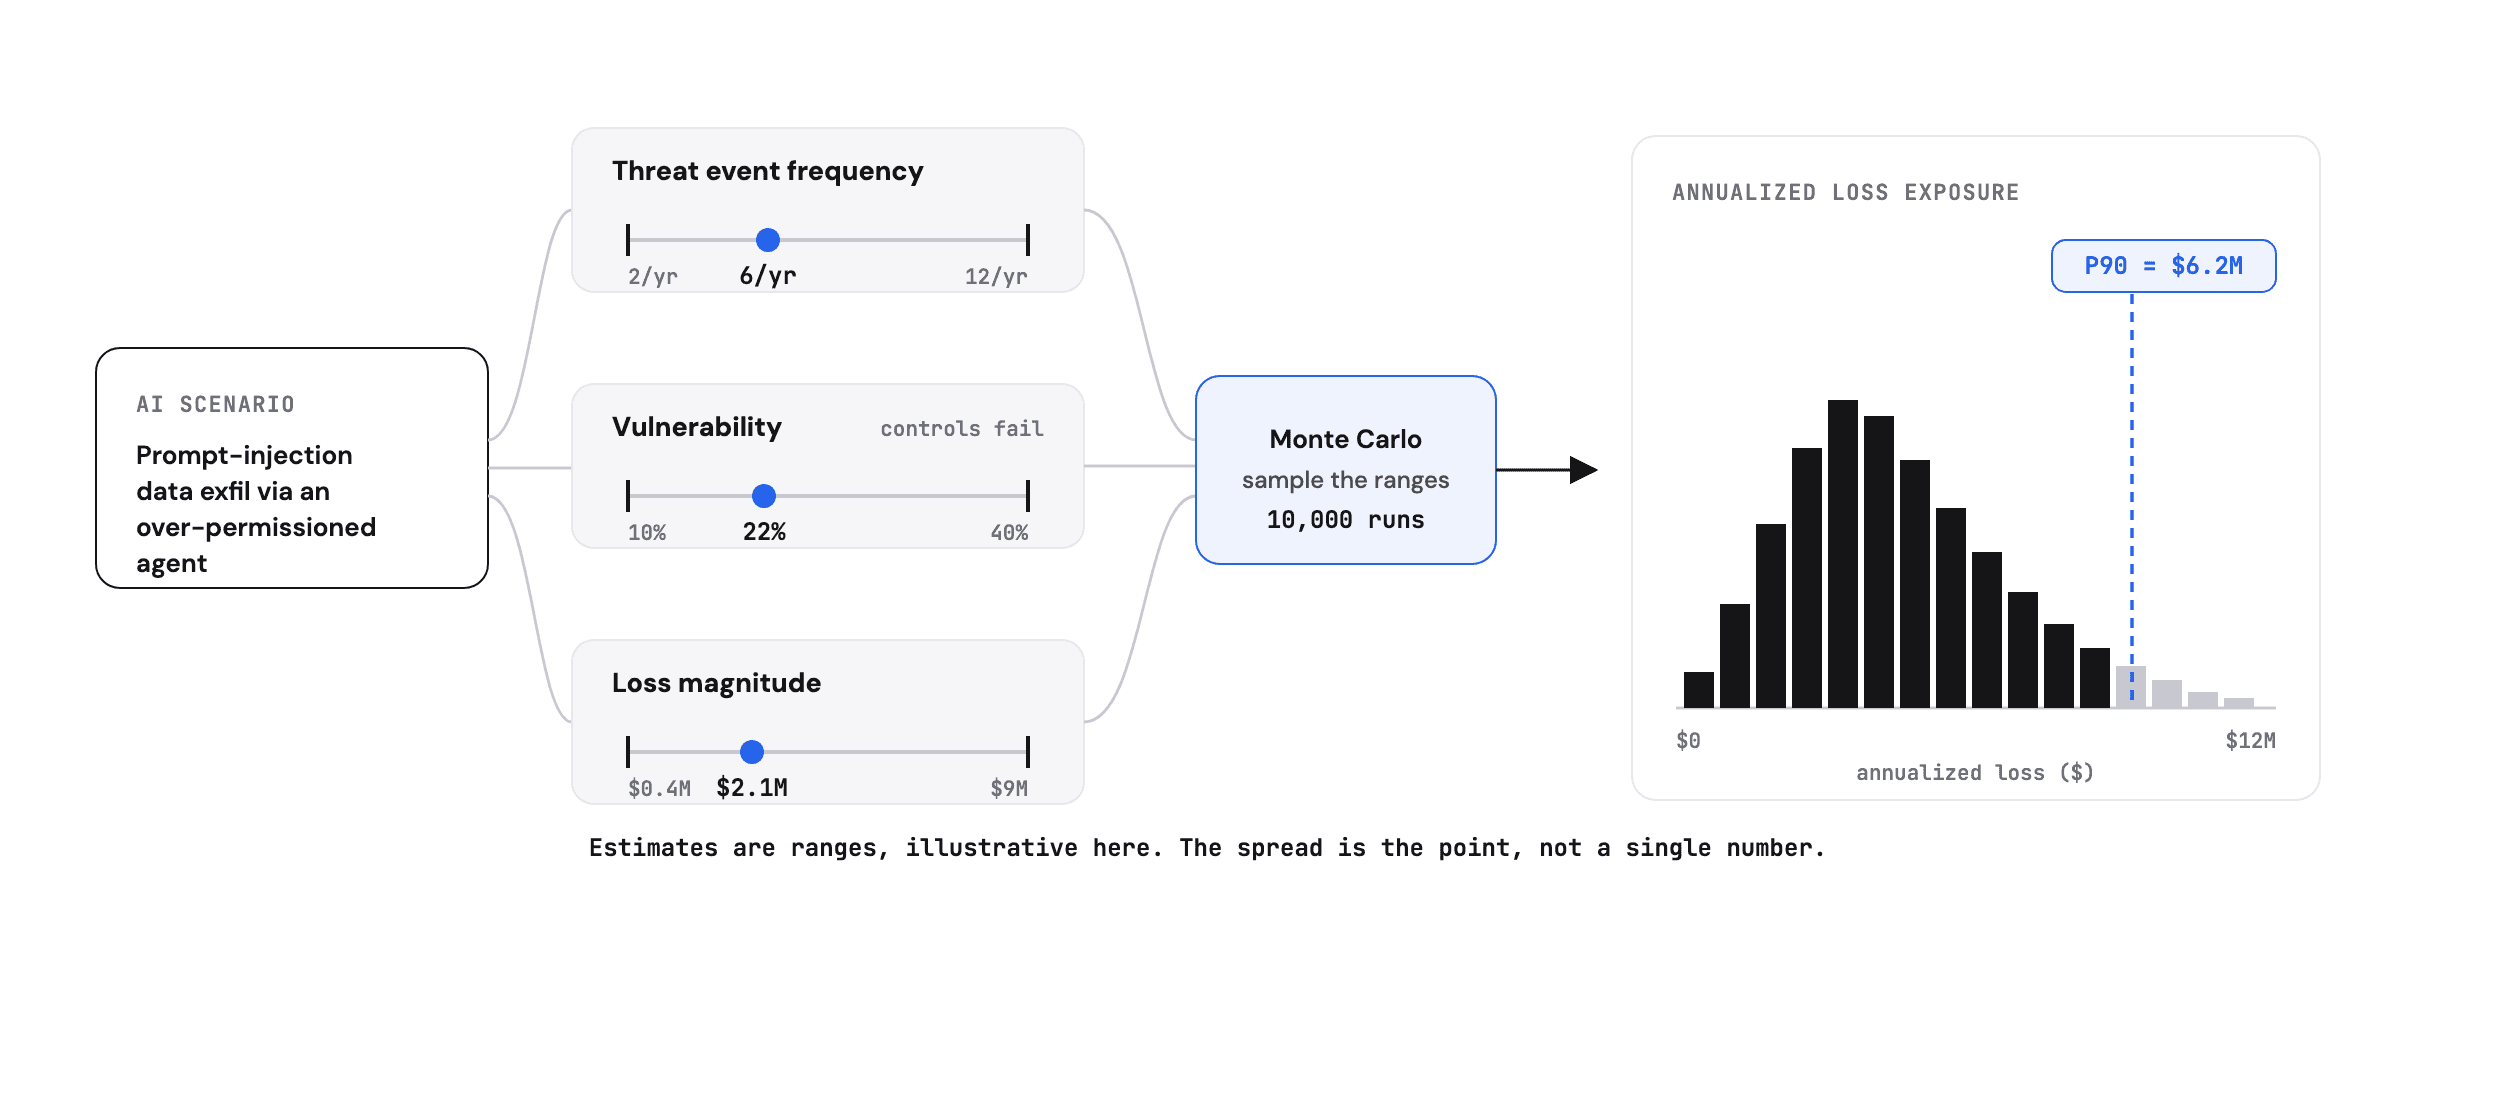
One AI scenario, decomposed into estimable ranges, run through Monte Carlo, and reported as a loss distribution with a P90 dollar figure.
FAIR is honest about its cost. It needs calibrated estimates, and building them takes effort and skill, which is why it stayed with specialist risk-quant teams for years. It does not predict the future. What it does is reduce the uncertainty around a decision enough that the decision can be made with numbers instead of colors.
Model the AI scenario, then govern with the number.
Two tracks. The first turns a scenario into a loss distribution. The second puts that number to work. Neither is optional once the board is being asked to fund controls.
AModel the AI scenario
When you assess the risk
1Name the scenario and the loss, not a category
“AI risk” is not assessable. “Prompt-injection exfiltration of customer PII through the support agent” is. Write the specific event and the specific loss it causes.
Closes no actuarial history
2Estimate the parts as ranges
Give Threat Event Frequency, Vulnerability, and Loss Magnitude each a min / most-likely / max. Ranges are defensible where point estimates are not, and they make disagreement explicit instead of burying it in a bucket.
Closes severity flattening
3Include the secondary loss
Fines, legal, notification, and churn often dwarf the response cost. An AI incident that exposes PII carries regulatory and reputational tails, so model them.
Closes no dollars for the decision
4Run the Monte Carlo, report the distribution
Sample the ranges thousands of times and present annualized loss exposure with percentiles, not a single number. The spread is the information.
Closes severity flattening
BGovern with the number
When you take it to the board
1Rank AI scenarios by loss exposure
A dollar-based list tells the board which AI risk to fund first. A grid full of ambers does not.
Closes no dollars for the decision
2Tie each scenario to your framework evidence
Map the modeled scenarios to ISO/IEC 42001 clause 6.1.2 and the NIST AI RMF MEASURE function, so the quantification is the risk assessment the auditor is asking for, not a parallel exercise.
Closes no actuarial history
3Simulate the guardrail's ROI
Re-run the scenario with the proposed control's effect on Vulnerability, and show the shift in loss exposure. That delta, in dollars, is the case for the spend.
Closes no dollars for the decision
4Re-run as the AI system changes
Models get swapped, agents gain permissions, new features ship. Each change moves the inputs, so treat the estimate as a living number and refresh it, especially where one dependency is shared.
Closes hidden correlation
A heat map is a communication tool wearing the costume of an analysis.
It was fine when risk meant familiar, independent, well-documented events. AI risk is none of those: new, correlated, and expensive in ways that only show up in dollars. ISO 42001 and the NIST AI RMF now ask for a real assessment, and the board is asking what the number is. FAIR is how you give them one you can defend, with the uncertainty on the page instead of hidden in a color.
See how Zania quantifies first-party risk with FAIR →
Sources
01ISO/IEC 42001:2023, AI management system standard (Clause 6.1 risk assessment and treatment)
02NIST AI Risk Management Framework (AI RMF 1.0): Govern, Map, Measure, Manage
03IBM, Cost of a Data Breach Report 2025 (global average $4.44M; shadow AI +$670K)
04Arup revealed as victim of $25M deepfake scam, CNN Business, May 2024
05Factor Analysis of Information Risk (FAIR) Standard v3.0, The FAIR Institute (2025)
06The Open Group Risk Analysis (O-RA) / FAIR body of standards
Share
